
Snow, ice or rain? Winter storm forecasts often disagree about who gets what. This explainer walks through why predicting winter precipitation type is so difficult, using a major January 2026 U.S. storm as a worked example. It draws on reporting by Andrea Thompson for Scientific American and is verified against the underlying science.
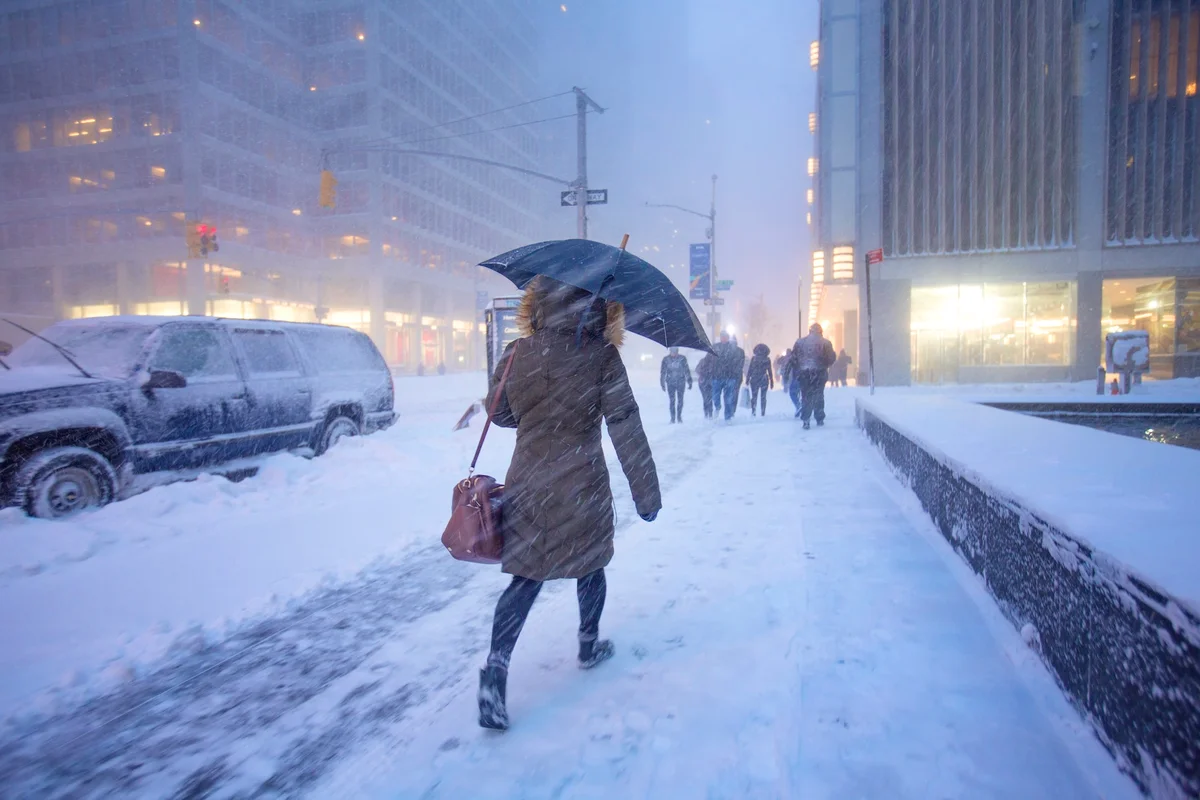
Manhattan during a blizzard.
Bill Hornstein/Getty Images
Manhattan during a blizzard. Bill Hornstein/Getty Images
In late January 2026, a major winter storm affected dozens of states and more than 160 million people across the United States with snow, ice and extreme cold over several days. Forecasters had a broad sense of what was coming — a foot or more of snow in some areas, dangerous freezing rain in others, and merely cold, damp conditions elsewhere — yet pinning down exactly which places would see which type of precipitation remained difficult, shifting day to day and even hour to hour.
Winter weather forecasting is exceptionally hard to get exactly right, and the reasons are worth understanding. Knowing what to look for in the forecasts ahead of a major storm can make the difference between being caught off guard and being prepared.
What drives a large winter storm
The basic ingredients are simple. Arctic air pushes south over the contiguous United States just as an area of low pressure tracks eastward, drawing moisture up from the south. Where that moisture meets cold enough temperatures, the result is some combination of snow, sleet and freezing rain.

Minimal wind chills expected across US
That is only the outline. Several features of the atmosphere determine which precipitation type actually reaches the ground, and small differences matter enormously.
Why precipitation type is so hard to call
The critical factor is the vertical temperature profile — how warm or cold the air is at each altitude between the cloud and the ground. Precipitation typically begins as snow high up. Whether it lands as snow, sleet, freezing rain or plain rain depends on the thin layers of above- and below-freezing air it passes through on the way down. A warm layer only a few hundred meters thick can melt falling snow into rain that then refreezes on contact with cold surfaces as treacherous ice. Because these layers are shallow and can shift quickly, the rain-snow line can move tens of miles over a few hours, turning a clean forecast into a difficult judgment call.
Why forecasts disagree: the models
Ahead of a major storm, different forecasts often rely on different numerical models — notably the U.S. National Weather Service’s Global Forecast System and the model run by the European Centre for Medium-Range Weather Forecasts (ECMWF). These models ingest measurements of the atmosphere and project them forward, and their outputs can differ substantially. Broadly, the European model has a long track record as the most accurate of the major global models.
Weather models are the product of decades of research, but they are necessarily imperfect. The atmosphere cannot be simulated exactly, so models approximate much of its physics, and different weather services make different choices about what to prioritize based on the weather they most often face — the U.S. system, for instance, places more emphasis on modeling tornadoes than the UK Met Office needs to. Those design choices show up as disagreements between forecasts.

Areas colored red and orange are more likely to receive more than six inches of snowfall.
Why data quality matters — and a current concern
Models are only as good as the observations fed into them: the more detailed and accurate the input data, the better the forecast. A key source is the twice-daily weather-balloon launches conducted at weather offices across the country, each providing a snapshot of atmospheric conditions. In 2025, the National Weather Service reduced or suspended balloon launches at roughly a dozen sites, including several in Alaska and the Plains, citing staffing shortages, as documented by NBC News. Meteorologists have warned this can degrade the data going into forecasts — a concern that is amplified when a storm’s evolution hinges on conditions over a data-sparse region.
Even so, having a range of models with different strengths and weaknesses is an advantage, because together they map out the plausible scenarios. As one forecaster put it, the sum of the parts gives the best answer. As a storm nears, the different national models typically converge — and in the January 2026 case, they increasingly aligned on the outcome the European model had flagged.

Areas colored red and orange have a higher chance of freezing rain of at least a quarter inch.
Even a confident forecast has limits
Once models agree on a storm’s track and timing, small-scale features can still upend the details. Heavy snow and rain often organize into narrow “bands,” and exactly where those bands set up is hard to predict even on the day of the storm. The difference can be dramatic: a foot of snow in one town and only a few inches — or nothing — a few miles away. Storms are highly dynamic, and small changes in temperature or upper-atmosphere airflow can have outsized consequences at the surface.
Limitations and what to watch
Forecasting continues to improve, including through AI-based weather models now being developed alongside traditional physics-based ones, but no forecast can eliminate the uncertainty inherent in a chaotic atmosphere. The practical takeaway is to read winter forecasts as ranges of likely outcomes rather than fixed predictions, to pay attention to the precipitation-type risk (ice is often more dangerous than snow), and to watch how forecasts firm up in the final 24 to 48 hours as the models converge.
