

Image by author
# Introduction
You’ve probably done your fair share of data science and machine learning projects.
They’re great for honing skills and showing off what you know and have learned. But the thing is: they often stop short of what real-world, production-level data science looks like.
In this article, we take a project – the US occupational salary analysis – and turn it into something that says, “It’s ready for use in the real world.”
For this, we will go through a simple but solid Machine Learning Operations (MLOPS) setup that covers everything from version control to deployment.
It’s great for early-career data people, freelancers, portfolio builders, or anyone who wants their work to look like it comes from a professional setup, even if it doesn’t.
In this article, we will move beyond notebook projects: we will set up our MLOps architecture, learn how to create reproducible pipelines, model artifacts, a simple native application programming interface (API), logging, and, finally, useful documentation.

Image by author
# Understanding Tasks and Datasets
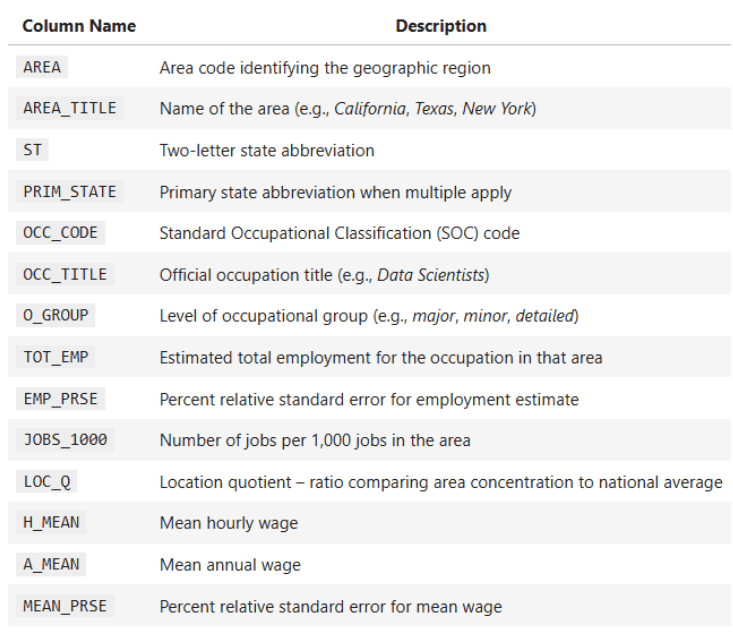
The project scenario consists of a national US dataset containing annual occupational wage and employment data for all 50 US states and territories. The data details employment totals, average wages, occupational groups, salary percentages and geographic identifiers.

Your main objectives are:
- Comparing differences in salaries across different states and job categories
- Running statistical tests (t-test, z-test, f-test)
- Building regressions to understand the relationship between employment and wages.
- Visualizing salary distribution and business trends
Some key columns of the dataset:
OCC_TITLE– Business NameTOT_EMP– total employmentA_MEAN— average annual salaryPRIM_STATE– State AbbreviationO_GROUP– Business Category (Major, Total, Detailed)
Your mission here is to generate reliable insights about pay disparities, job distribution, and statistical relationships, but it doesn’t stop there.
The challenge is also to design the project in such a way that it becomes reusable, reproducible and clean. This is a very important skill required for all data scientists nowadays.
# Get started with version control
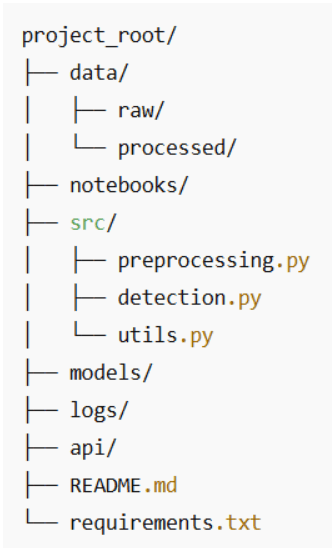
Let’s not skip the basics. Even small projects deserve a clean structure and proper version control. Here’s a folder setup that’s both intuitive and reviewer-friendly:
Some Best Practices:
- Keep raw data immutable. You don’t need to touch it, just copy it for processing.
- consider using git lfs If your dataset becomes big and thick.
- put each script in
src/Focused on one thing. Your future self will thank you. - Commit often and use clear messages like:
feat: add T-test comparison between management and production wages.
Even with this simple structure, you’re showing hiring managers that you’re thinking and planning like a professional, not like a junior.
# Building reproducible pipelines (and leaving notebook chaos behind)
Notebooks are wonderful for exploration. You put in some effort, change a filter, redraw a cell, copy a chart, and before you know it, you’ve got 40 cells and you have no idea what the final answer actually is.
To make this project feel more “production-ish”, we’ll take the logic that already exists in the notebook and wrap it in a preprocessing function. That function becomes the single, canonical place to have US occupational salary data:
- loaded from excel file
- Cleared and converted to numeric
- Generalized (State, Occupation Group, Occupation Code)
- Enriched with supporting columns like Total Payroll
From then on, every analysis – plot, t-test, regression, correlation, z-test – will reuse the same cleaned dataframe.
// From top-of-notebook cells to reusable functions
Right now, the notebook does roughly this:
- Loads the file:
state_M2024_dl.xlsx - Parses the first sheet into a dataframe
- Transforms columns like
A_MEAN,TOT_EMPto numerical - Those columns are used in:
- State-level salary comparison
- linear regression (
TOT_EMP→A_MEAN) - Pearson Correlation (Q6)
- Z-test for technical vs non-technical (Q7)
- Levene test for pay differentials
We’ll turn that into a single function called preprocess_wage_data You can call from anywhere in the project:
from src.preprocessing import preprocess_wage_data
df = preprocess_wage_data("data/raw/state_M2024_dl.xlsx")
Now your notebook, script, or future API calls all agree on what “clean data” means.
// What does the preprocessing pipeline actually do

For this dataset, the preprocessing pipeline would be:
1. Load the Excel file once.
xls = pd.ExcelFile(file_path)
df_raw = xls.parse(xls.sheet_names(0))
df_raw.head()
2. Convert key numeric columns to numeric.
These are the columns that your analysis actually uses:
- Employment and intensity:
TOT_EMP,EMP_PRSE,JOBS_1000,LOC_QUOTIENT - Salary Solution:
H_MEAN,A_MEAN,MEAN_PRSE - Salary Percentage:
H_PCT10,H_PCT25,H_MEDIAN,H_PCT75,H_PCT90,A_PCT10,A_PCT25,A_MEDIAN,A_PCT75,A_PCT90
We force them safely:
df = df_raw.copy()
numeric_cols = (
        "TOT_EMP", "EMP_PRSE", "JOBS_1000", "LOC_QUOTIENT" ….)
for col in numeric_cols:
        if col in df.columns:
            df(col) = pd.to_numeric(df(col), errors="coerce")
If the future file contains strange values (e.g. ‘**’ or ‘N/A’), your code won’t explode, it will simply treat them as missing, and the pipeline won’t break.
3. Normalize text recognizers.
For consistent grouping and filtering:
PRIM_STATEIn uppercase (e.g. “ca” → “CA”)O_GROUPIn lowercase (e.g. “major” → “major”)OCC_CODEto string (for).str.startswith("15")Technical vs non-technical in Z-test)
4. Add auxiliary columns used in the analysis.
These are simple but useful. The assistant’s, average salary for total payroll per line is estimated using:
df("TOTAL_PAYROLL") = df("A_MEAN") * df("TOT_EMP")The wage-to-employment ratio is useful for locating high wage/low employment areas, with protection against division by zero:
df("WAGE_EMP_RATIO") = df("A_MEAN") / df("TOT_EMP").replace({0: np.nan})5. Return a clean dataframe for the rest of the project.
Your subsequent code for this:
- Plotting top/bottom states
- t-test (management vs production)
- Regression (
TOT_EMP→A_MEAN) - Correlation (Q6)
- Z-test (Q7)
- Levene’s test
Everyone can start with:
df = preprocess_wage_data("state_M2024_dl.xlsx")Full preprocessing functions:
put it in src/preprocessing.py: :
import pandas as pd
import numpy as np
def preprocess_wage_data(file_path: str = "state_M2024_dl.xlsx") -> pd.DataFrame:
    """Load and clean the U.S. occupational wage data from Excel.
    - Reads the first sheet of the Excel file.
    - Ensures key numeric columns are numeric.
    - Normalizes text identifiers (state, occupation group, occupation code).
    - Adds helper columns used in later analysis.
    """
    # Load raw Excel file
    xls = pd.ExcelFile(file_path)
check the rest of the code Here.
# Saving your statistical models and artifacts
What are model artifacts? Some examples: regression models, correlation matrices, cleaned datasets and statistics.
import joblib
joblib.dump(model, "models/employment_wage_regression.pkl")
Why save artifacts?
- You avoid recalculating results during API calls or dashboards
- You save the version for future comparisons
- You keep analysis and speculation separate
These little habits elevate your project from exploratory to production-friendly.
# Getting it working locally (with API or small web UI)
You don’t have to go straight to Docker and Kubernetes to “deploy” it. For a lot of real-world analytics tasks, your first API is simply:
- A clean preprocessing function
- Some famous analytical works
- A small script or notebook cell that links them together
This alone makes it easy to call your project:
- another notebook
- A Streamlit/Gradio Dashboard
- FastAPI or Flask app of the future
// Turning your analytics into a small “Analytics API”
You already have the main logic in the notebook:
- T-Test: Management vs. Production Wages
- Regression:
TOT_EMP→A_MEAN - Pearson Correlation (Q6)
- Z-Test Technical vs Non-Technical (Q7)
- Levene’s test for pay differentials
We’ll wrap at least one of them in a function so that it behaves like a small API endpoint.
Example: “Compare management vs. production salaries”
This is a function version of the t-test code that’s already in the notebook:
from scipy.stats import ttest_ind
import pandas as pd
def compare_management_vs_production(df: pd.DataFrame):
    """Two-sample T-test between Management and Production occupations."""
    # Filter for relevant occupations
    mgmt = df(df("OCC_TITLE").str.contains("Management", case=False, na=False))
    prod = df(df("OCC_TITLE").str.contains("Production", case=False, na=False))
    # Drop missing values
    mgmt_wages = mgmt("A_MEAN").dropna()
    prod_wages = prod("A_MEAN").dropna()
    # Perform two-sample T-test (Welch's t-test)
    t_stat, p_value = ttest_ind(mgmt_wages, prod_wages, equal_var=False)
    return t_stat, p_value
Now this test can be reused:
- a main script
- a streamline slider
- FastAPI path of the future
Without copying any notebook cells.
// A simple local entry point
Here’s how all the pieces fit together in a plain Python script that you can call main.py Or run in a notebook cell:
from preprocessing import preprocess_wage_data
from statistics import run_q6_pearson_test, run_q7_ztest  # move these from the notebook
from analysis import compare_management_vs_production      # the function above
if __name__ == "__main__":
    # 1. Load and preprocess the data
    df = preprocess_wage_data("state_M2024_dl.xlsx")
    # 2. Run core analyses
    t_stat, p_value = compare_management_vs_production(df)
    print(f"T-test (Management vs Production) -> t={t_stat:.2f}, p={p_value:.4f}")
    corr_q6, p_q6 = run_q6_pearson_test(df)
    print(f"Pearson correlation (TOT_EMP vs A_MEAN) -> r={corr_q6:.4f}, p={p_q6:.4f}")
    z_q7 = run_q7_ztest(df)
    print(f"Z-test (Tech vs Non-tech median wages) -> z={z_q7:.4f}")
It doesn’t look like a web API yet, but conceptually it is:
- Input: Cleared DataFrame
- Operations: Designated Analytical Functions
- Output: Well-defined numbers that you can display in dashboards, reports, or later, in REST endpoints.
# Logging everything (even details)
Most people overlook logging, but it is the way you make your project debuggable and reliable.
Even in a beginner-friendly analytics project like this, it’s useful to know:
- what file have you loaded
- How many rows survived preprocessing
- which tests were run
- What were the key data from the trial?
Instead of manually printing everything and scrolling through notebook output, we’ll set up a simple logging configuration that you can reuse across scripts and notebooks.
// basic logging setup
create a logs/ folder in your project, and then add it somewhere first in your code (for example at the top). main.py or in a dedicated logging_config.py):
import logging
from pathlib import Path
# Make sure logs/ exists
Path("logs").mkdir(exist_ok=True)
logging.basicConfig(
    filename="logs/pipeline.log",
    level=logging.INFO,
    format="%(asctime)s - %(levelname)s - %(message)s"
)
Now, every time you run your pipeline, a logs/pipeline.log The file will be updated.
// Log preprocessing and analysis
We can extend the main example from step 5 to log what’s happening:
from preprocessing import preprocess_wage_data
from statistics import run_q6_pearson_test, run_q7_ztest
from analysis import compare_management_vs_production
import logging
if __name__ == "__main__":
    logging.info("Starting wage analysis pipeline.")
    # 1. Preprocess data
    df = preprocess_wage_data("state_M2024_dl.xlsx")
    logging.info("Loaded cleaned dataset with %d rows and %d columns.", df.shape(0), df.shape(1))
    # 2. T-test: Management vs Production
    t_stat, p_value = compare_management_vs_production(df)
    logging.info("T-test (Mgmt vs Prod) -> t=%.3f, p=%.4f", t_stat, p_value)
    # 3. Pearson correlation (Q6)
    corr_q6, p_q6 = run_q6_pearson_test(df)
    logging.info("Pearson (TOT_EMP vs A_MEAN) -> r=%.4f, p=%.4f", corr_q6, p_q6)
    # 4. Z-test (Q7)
    z_q7 = run_q7_ztest(df)
    logging.info("Z-test (Tech vs Non-tech median wages) -> z=%.3f", z_q7)
    logging.info("Pipeline finished successfully.")
Now, instead of guessing what happened the last time you ran Notebook, you can open logs/pipeline.log And see a timeline of it:
- When preprocessing started
- how many rows/columns did you have
- What were the test statistics?
This is a small step, but a very “MLOPS” step worth doing: you’re not just running the analyses, you’re also observing them.
# Storytelling (Writing for Humans)
Documentation matters, especially when dealing with salary, occupation and regional comparisons, topics that real decision-makers care about.
Your README or final notebook should include:
- Why does this analysis matter
- Summary of Salary and Employment Pattern
- Key Visualizations (Top/Bottom Positions, Salary Distribution, Group Comparison)
- Explanation of each statistical test and why it was chosen
- Clear interpretation of regression and correlation results
- Limitations (e.g. missing state records, sampling variation)
- Next steps for deeper analysis or dashboard deployment
Good documentation turns a dataset project into something that anyone can use and understand.
# conclusion
Why does all this matter?
Because in the real world, data science doesn’t live in a vacuum. Your beautiful model is no help if no one else can drive it, understand it, or trust it. This is where MLOps comes in, not as a buzzword, but as a bridge between a cool experiment and an actual, usable product.
In this article, we started with a typical notebook-based assignment and showed how to give it structure and staying power. We introduced:
- Version control to keep our work organized
- Clean, reproducible pipelines for preprocessing and detection
- Model serialization so that we can reuse (not retrain) our models.
- A lightweight API for local deployment
- Logging to keep track of what’s going on behind the scenes
- And finally, documentation that speaks to both technical experts and business people
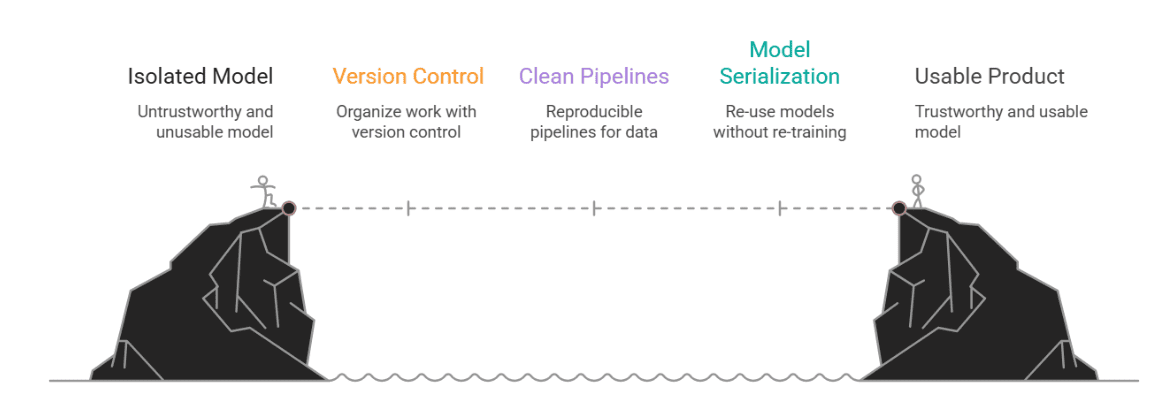
Image by author
Nate Rosidi Is a data scientist and is into product strategy. He is also an adjunct professor teaching analytics, and is the founder of StratScratch, a platform that helps data scientists prepare for their interviews with real interview questions from top companies. Nate writes on the latest trends in the career market, gives interview advice, shares data science projects, and covers everything SQL.