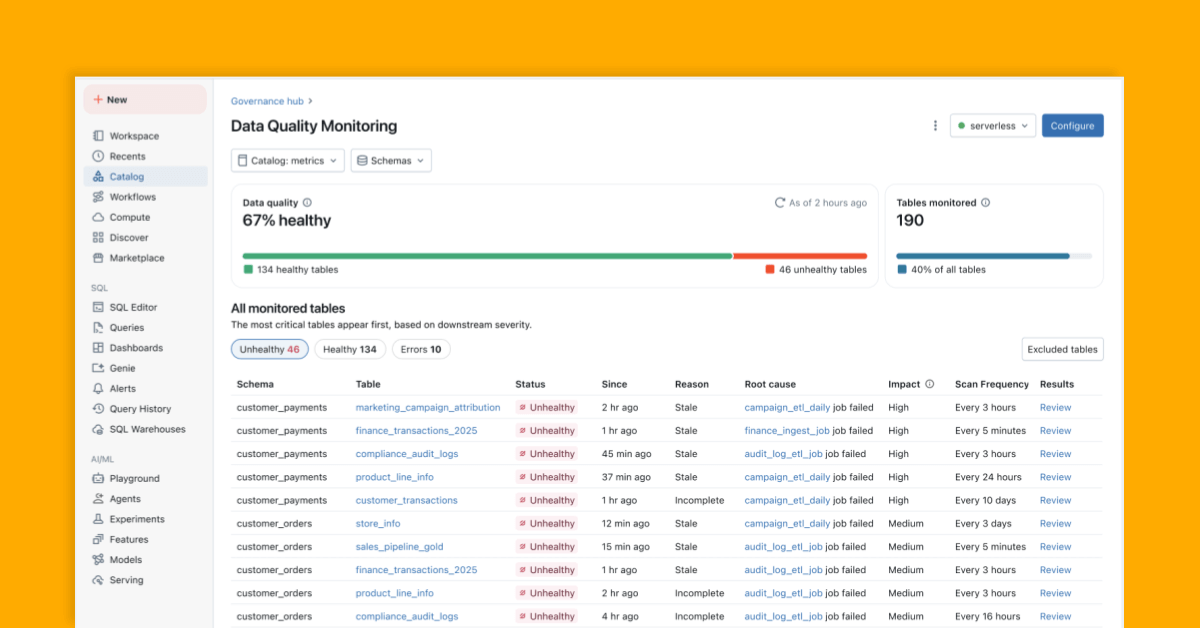
As organizations create more data and AI products, keeping that data trustworthy gets harder. Data now powers everything from executive dashboards to company-wide question-answering bots, and a stale or incorrect table quietly propagates wrong answers into decisions. Yet most data-quality practices have not kept pace with the scale of the problem. This article looks at the case for AI-driven, or “agentic,” data-quality monitoring — using a Databricks feature as the worked example — and where the approach still needs human judgment.
The Large-Scale Data Quality Challenge
Traditional data-quality work relies on manually defined rules applied to a small set of tables. As data estates grow, that model creates blind spots: teams constantly add new tables, each with its own patterns, and maintaining custom checks for every dataset becomes unsustainable. In practice only a handful of important tables get monitored while most assets go unchecked. The result is a paradox — organizations have more data than ever but less confidence in how to use it.
What Agentic Data Quality Monitoring Does
Databricks’ data-quality monitoring aims to close that gap with an AI-driven approach integrated into the platform, so teams detect issues earlier, prioritize what matters most, and resolve problems faster at enterprise scale. In a customer testimonial in the original Databricks announcement, Jake Rousis, lead data engineer at Alinta Energy, described the appeal as having the data flag a problem first — monitoring all tables with a hands-off, no-configuration approach rather than waiting for users to report issues.
How It Works: Two Complementary Methods
Anomaly Detection
Enabled at the schema level, anomaly detection monitors all critical tables without manual configuration, with AI agents learning historical patterns and seasonal behavior to identify unexpected changes:
- Learned behavior, not fixed rules: agents adapt to normal variation and monitor signals such as freshness and completeness, rather than firing on static thresholds.
- Intelligent scanning for scale: all tables in a schema are scanned once, then re-checked according to importance and update frequency. Unity Catalog lineage and usage determine which tables matter most — frequently queried tables are scanned more often, while static or obsolete tables are skipped automatically.
- System tables for visibility: table health, learned limits, and observed patterns are recorded in system tables that teams use for alerts, reporting, and deeper analysis.
Data Profiling
Enabled at the table level, data profiling captures summary statistics and tracks how they change over time. These metrics provide historical context and feed anomaly detection, making unexpected shifts easier to spot.
Keeping an Ever-Growing Data Estate Healthy
The practical value of automated monitoring shows up in three capabilities. Agentic, one-click monitoring covers an entire schema without hand-written rules or threshold tuning, learning seasonal behavior — weekend volume dips, tax-season spikes — to detect anomalies intelligently. A holistic health view consolidates the status of all tables in one place. And issues are prioritized by downstream impact: tables are ranked by their lineage and query volume, so a problem in a heavily used upstream table surfaces ahead of one in a rarely touched asset.
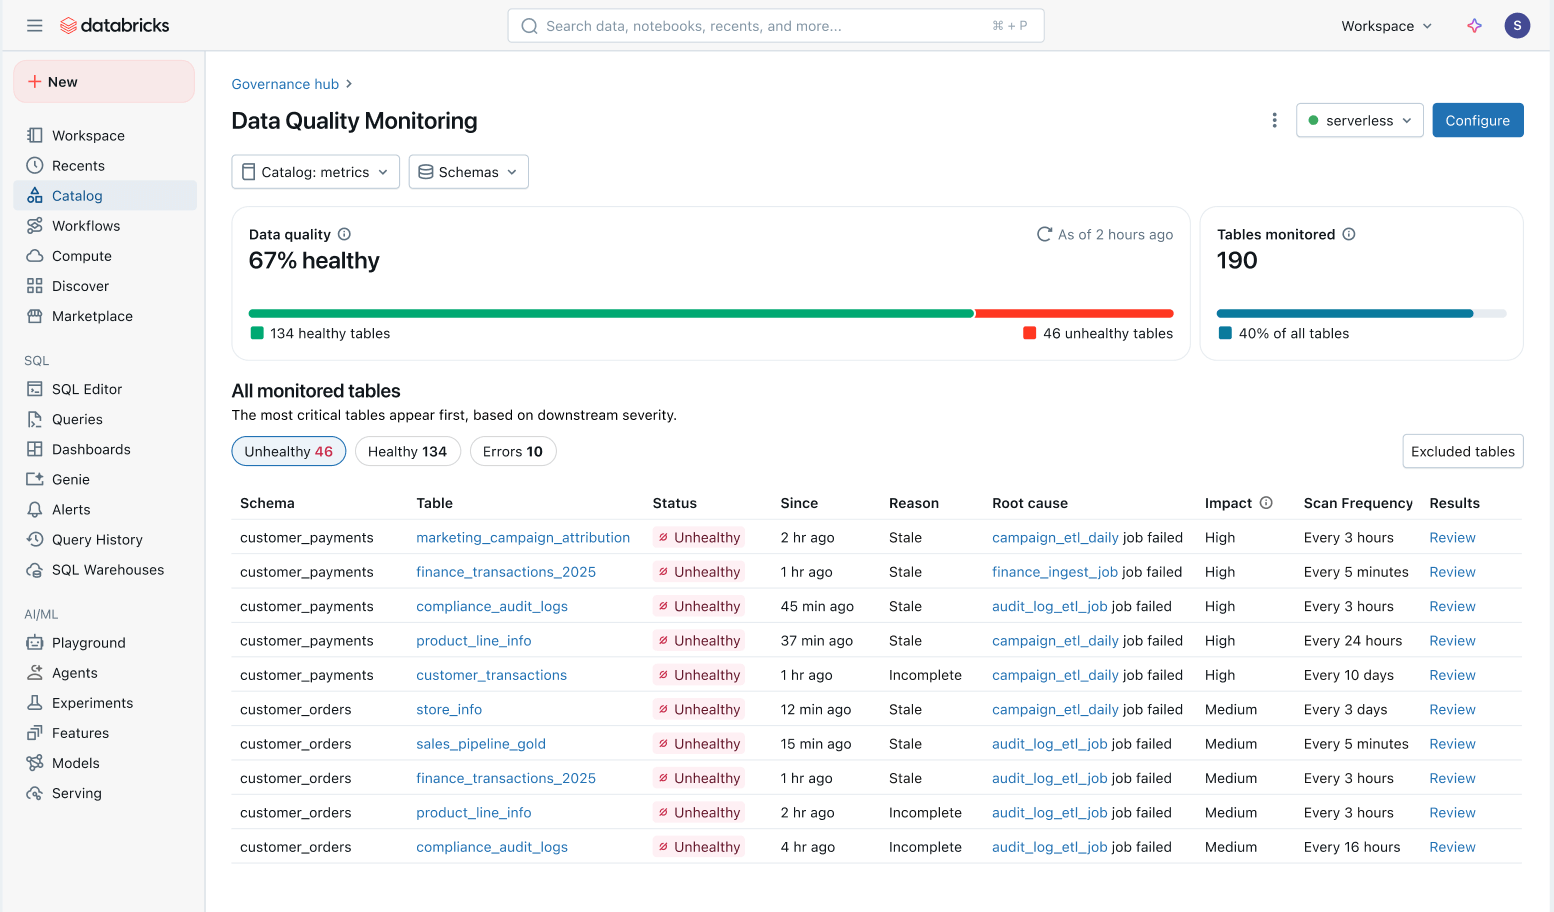
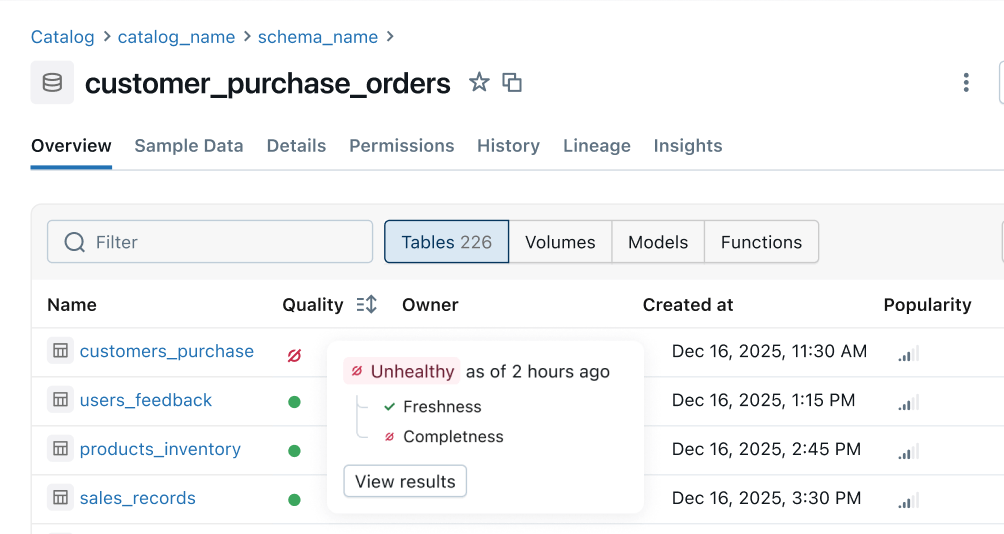
Continuous health indicators feed quality signals from upstream pipelines to downstream business surfaces, so engineering teams learn about issues earlier and consumers can immediately tell whether data is safe to use. Namit Pai, head of platform and data engineering at OnePay, framed the benefit in mission terms — catching issues early to ensure accuracy in analysis, reporting, and ML model development.
What Comes Next
Databricks has outlined a roadmap that includes more quality rules (percent nullity, uniqueness, validity), automated alerts with intelligent root-cause indicators built into jobs and pipelines, platform-wide health signals across Unity Catalog, Lakeflow observability, lineage, notebooks, and Genie, and the ability to filter and quarantine bad data before it reaches consumers. The feature is available in public preview.
Limitations and What to Watch
Automated monitoring changes the economics of coverage, but it is not a complete substitute for domain knowledge. Learned-baseline anomaly detection excels at catching statistical deviations — a table that stopped updating, a column whose null rate jumped — but it cannot know that a value is business-wrong when it looks statistically normal; semantic correctness still needs human-defined expectations. Agents that learn “normal” from history can also absorb a slow-developing problem into the baseline, or raise false alarms around genuine one-off events, so alert tuning is ongoing work. As with any platform-native capability, the deepest value accrues to teams already standardized on Databricks and Unity Catalog, since prioritization depends on that lineage and usage data. And customer quotes in vendor announcements describe best cases; results depend on data patterns and configuration. The durable takeaway is architectural: at scale, monitoring has to be driven by lineage and usage rather than hand-maintained rules — a shift toward governance by default, explored further in this related piece on unified AI governance.
