Databricks System Tables give data engineering teams a single, queryable place to see how their jobs and pipelines are actually behaving. Instead of stitching together clues from several tools, teams can run SQL against a consistent schema that exposes job metadata, task timelines, execution behaviour, configuration history, lineage, cost signals and ownership. This overview explains what the Lakeflow system tables contain, the operational patterns they support, and the practical limits worth keeping in mind.
The three-in-the-morning problem
Operational issues on a data platform tend to surface at the worst possible moment. A dashboard goes stale, a service-level agreement slips, and the on-call engineer is left guessing which part of the platform drifted. A task may run for hours without hitting a timeout. A pipeline may keep refreshing a table that nothing has read in months. A cluster may still be running an old runtime, and the person who knows who owns a job may be on leave.
These are recurring patterns for data teams: wasted compute from unused pipelines, reliability gaps from missing health rules, hygiene issues from outdated runtimes, and delays caused by unclear ownership. They appear quietly, grow slowly, and then become the thing that keeps an engineer awake. System Tables provide a consistent layer for identifying these issues quickly.
What Databricks System Tables expose
System Tables surface operational telemetry across the platform, including jobs, pipelines, compute, billing, lineage and more, in one governed location.
Social class | what it tracks |
lakeflow jobs | Task configuration, task definitions, run timeline |
lakeflow spark declarative pipeline | Pipeline metadata, update history |
Billing | Determining cost based on usage, workload |
genealogy | Table-level read/write dependencies |
clusters | Configuration, count usage |
The tables that track configuration use a slowly changing dimension (SCD Type 2) design, which preserves the full change history by inserting a new row for each update. That makes configuration auditing and historical analysis of platform state over time straightforward.
The Lakeflow system tables
The Lakeflow system tables retain data for roughly the last 365 days. For the SCD2 dimension tables, Databricks keeps the most recent record for each entity even when it is older than that window, so the latest state of a job, task or pipeline is always available. The current, authoritative list of tables and their relationships is maintained in the Databricks system tables documentation.
Jobs overview tables
Several jobs-related tables are generally available. The system.lakeflow.jobs table holds SCD2 metadata for jobs, including configuration and tags, which is useful for inventory, governance and configuration-drift analysis. The system.lakeflow.job_tasks table describes all job tasks, their definitions and dependencies, helping teams understand large-scale task structures. The system.lakeflow.job_run_timeline table is an immutable timeline of job runs over time, well suited to SLA and performance-trend analysis, while system.lakeflow.job_task_run_timeline provides the equivalent timeline for individual task runs within each job.
Common audit patterns
Teams commonly audit their Lakeflow jobs and pipelines for four purposes: optimising cost by finding scheduled tasks that update datasets nothing reads downstream; ensuring reliability by enforcing timeouts and runtime limits so runaway jobs do not breach SLAs; maintaining hygiene by verifying consistent runtime versions and configuration parameters; and assigning accountability by identifying job owners so follow-up is straightforward.
One pattern joins the Lakeflow jobs tables with the lineage and billing tables to find producers with no consumers, ranked by cost. Some of those jobs can be stopped immediately; others may need a deprecation plan if systems outside Databricks depend on them. A related pattern flags jobs missing reliability guardrails such as timeouts, and another surfaces the run-as user and creator for each job so issues can be routed to the right owner. Together these patterns form the foundation of operational observability: lower cost, fresher data, enforced reliability guardrails and clear ownership for remediation.
From ad-hoc queries to shared dashboards
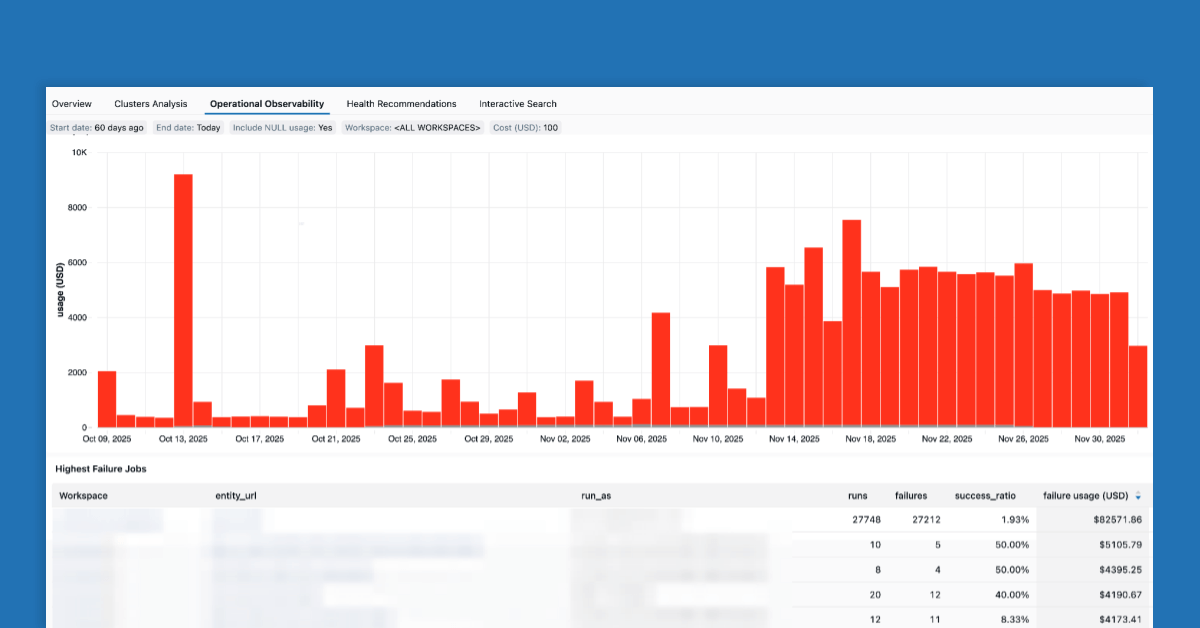
Running these queries on demand is useful, but day-to-day work benefits from a shared view the whole team can reference. Databricks provides a Lakeflow dashboard that gives a bird’s-eye view of jobs across workspaces, covering spend, aging pipelines, failures and optimisation opportunities. It can be imported into a workspace using the steps in the official documentation.
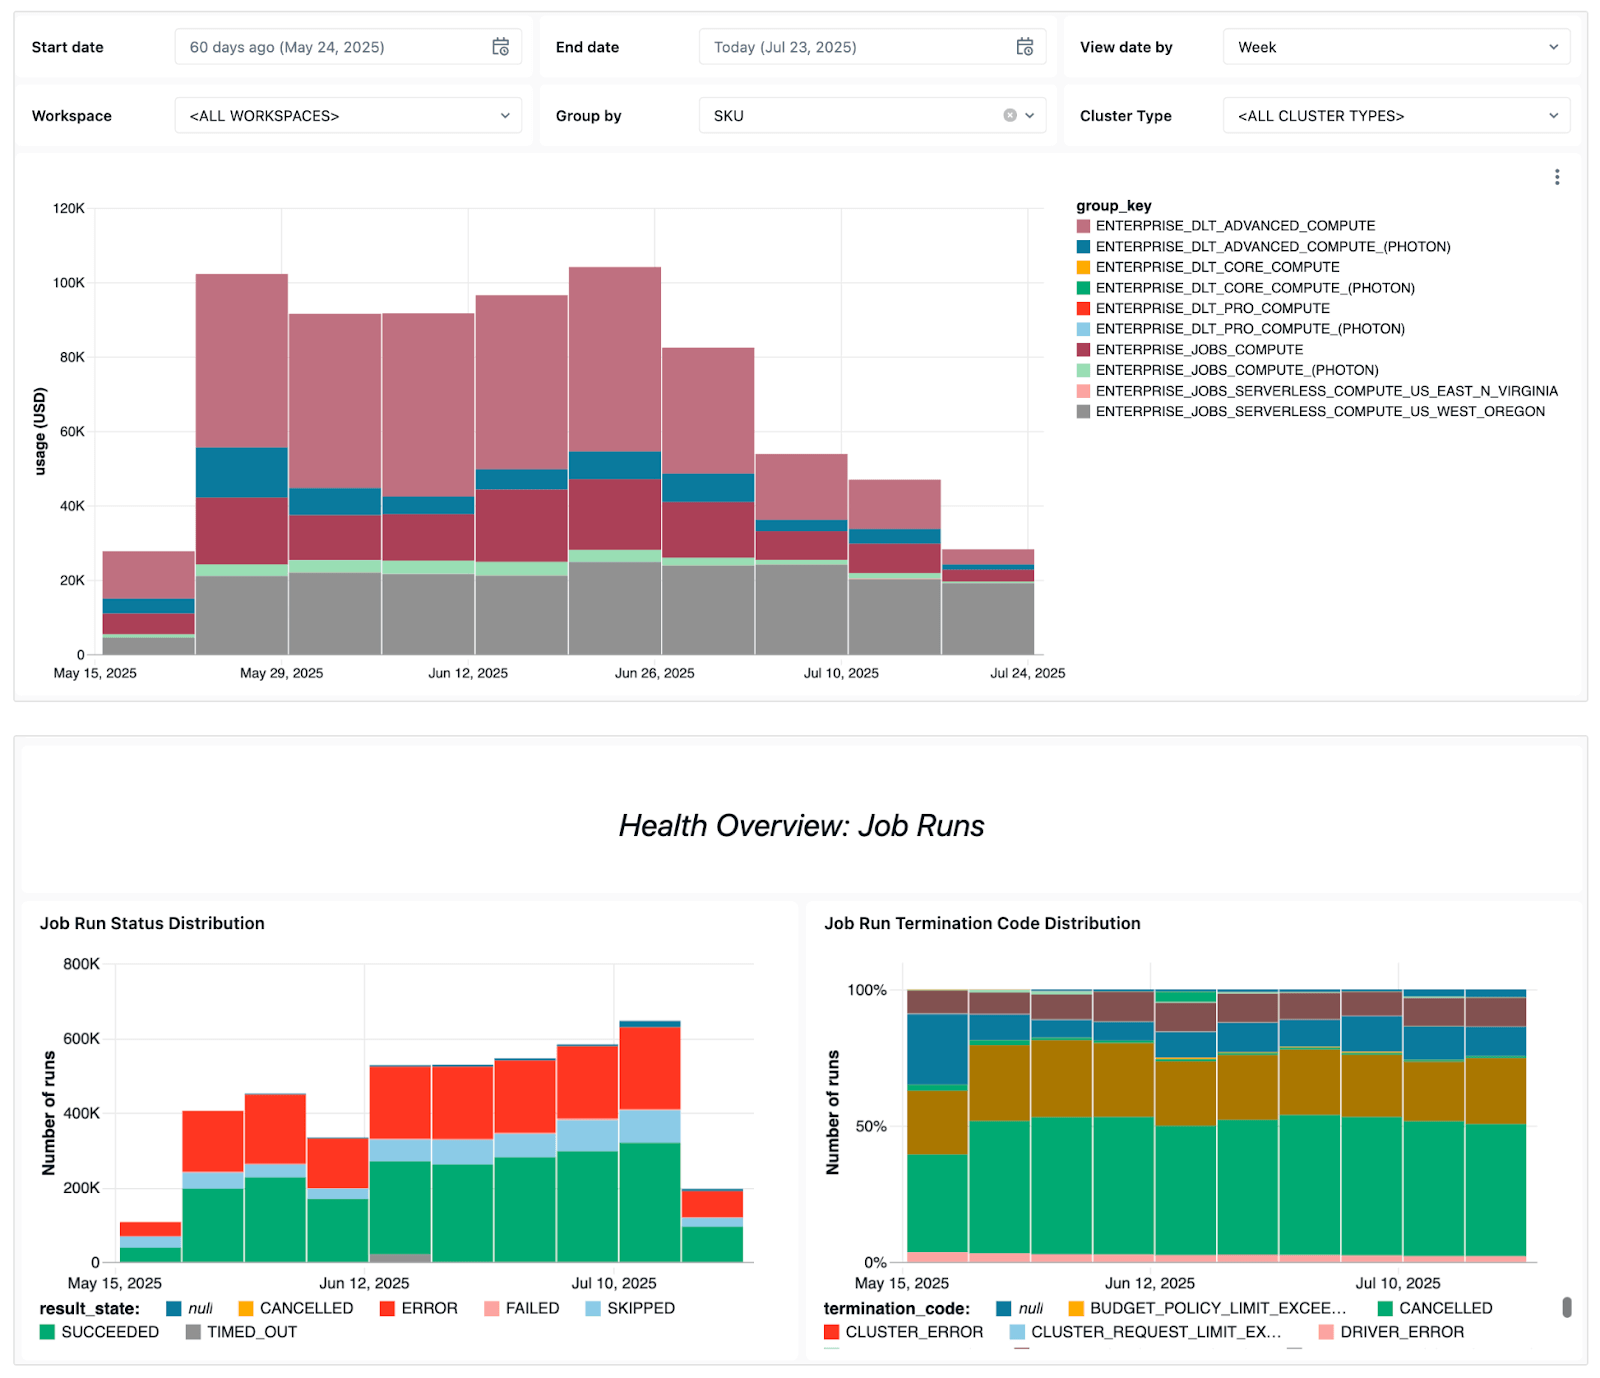
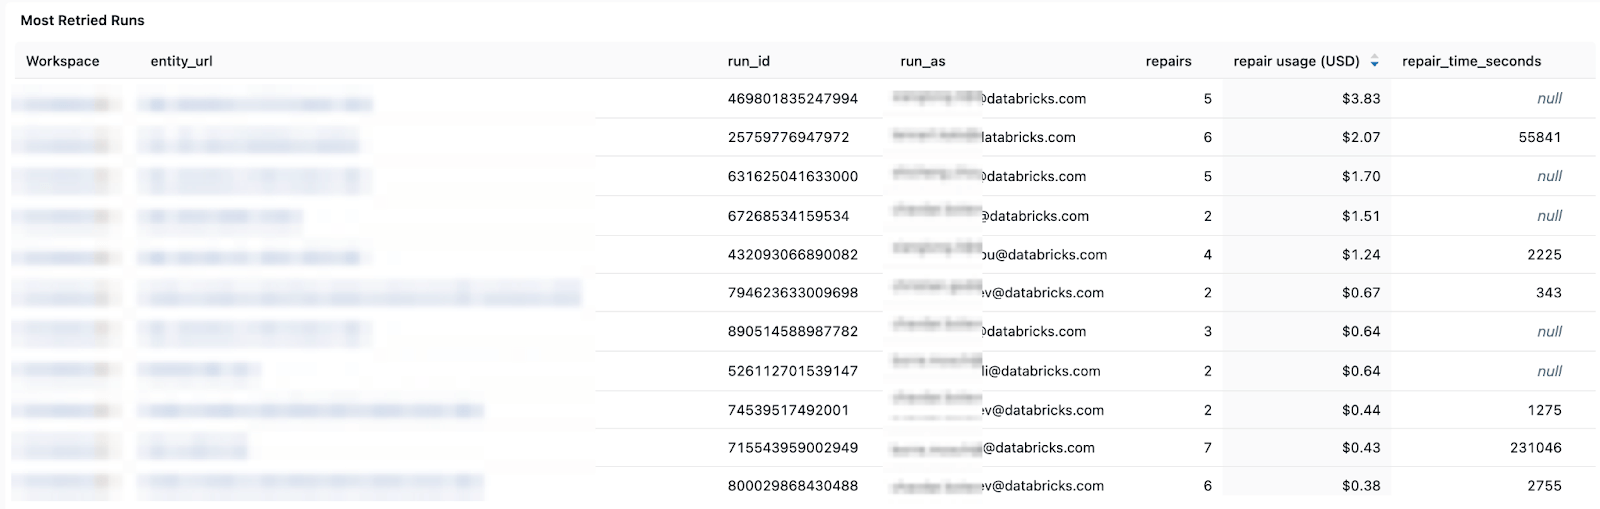
The dashboard brings several operational signals together. It highlights failure trends and the most common error messages, making it easy to see which jobs fail most often.
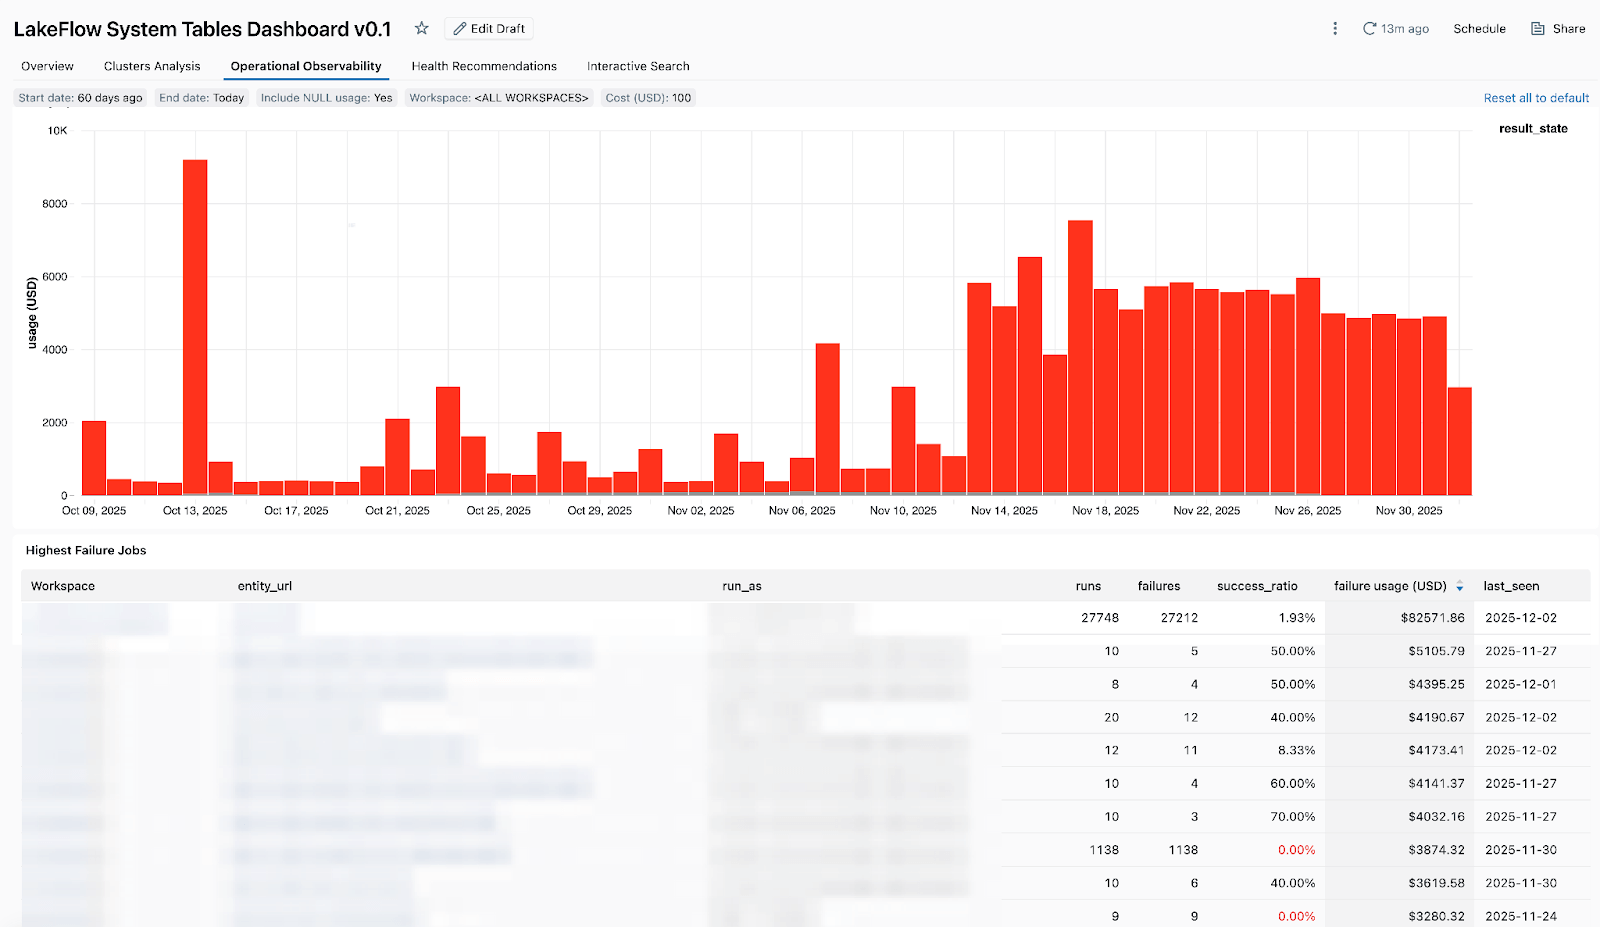
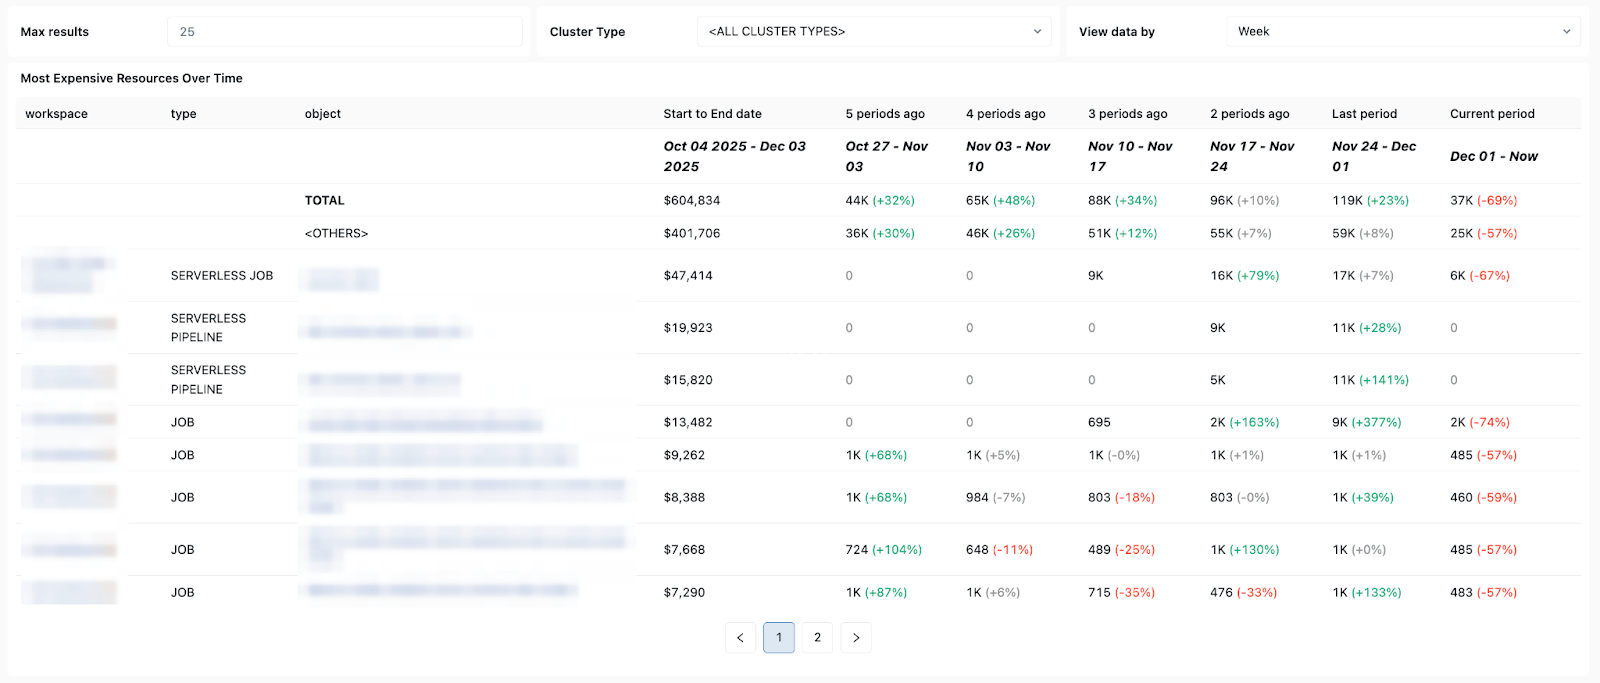
Cost views rank the most expensive jobs in a selected period and show how their spend trends over time.
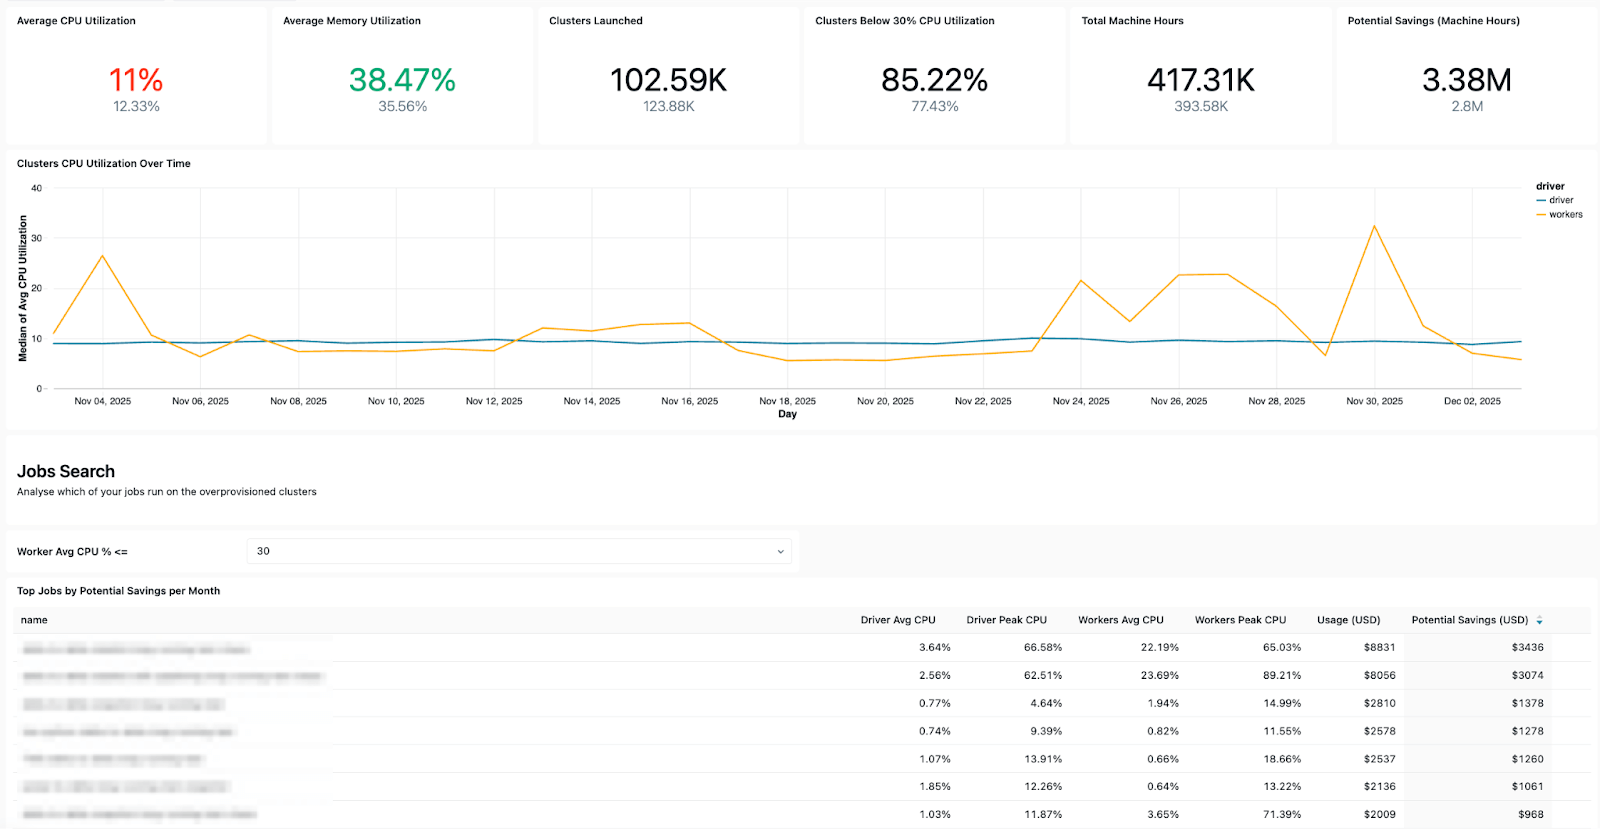
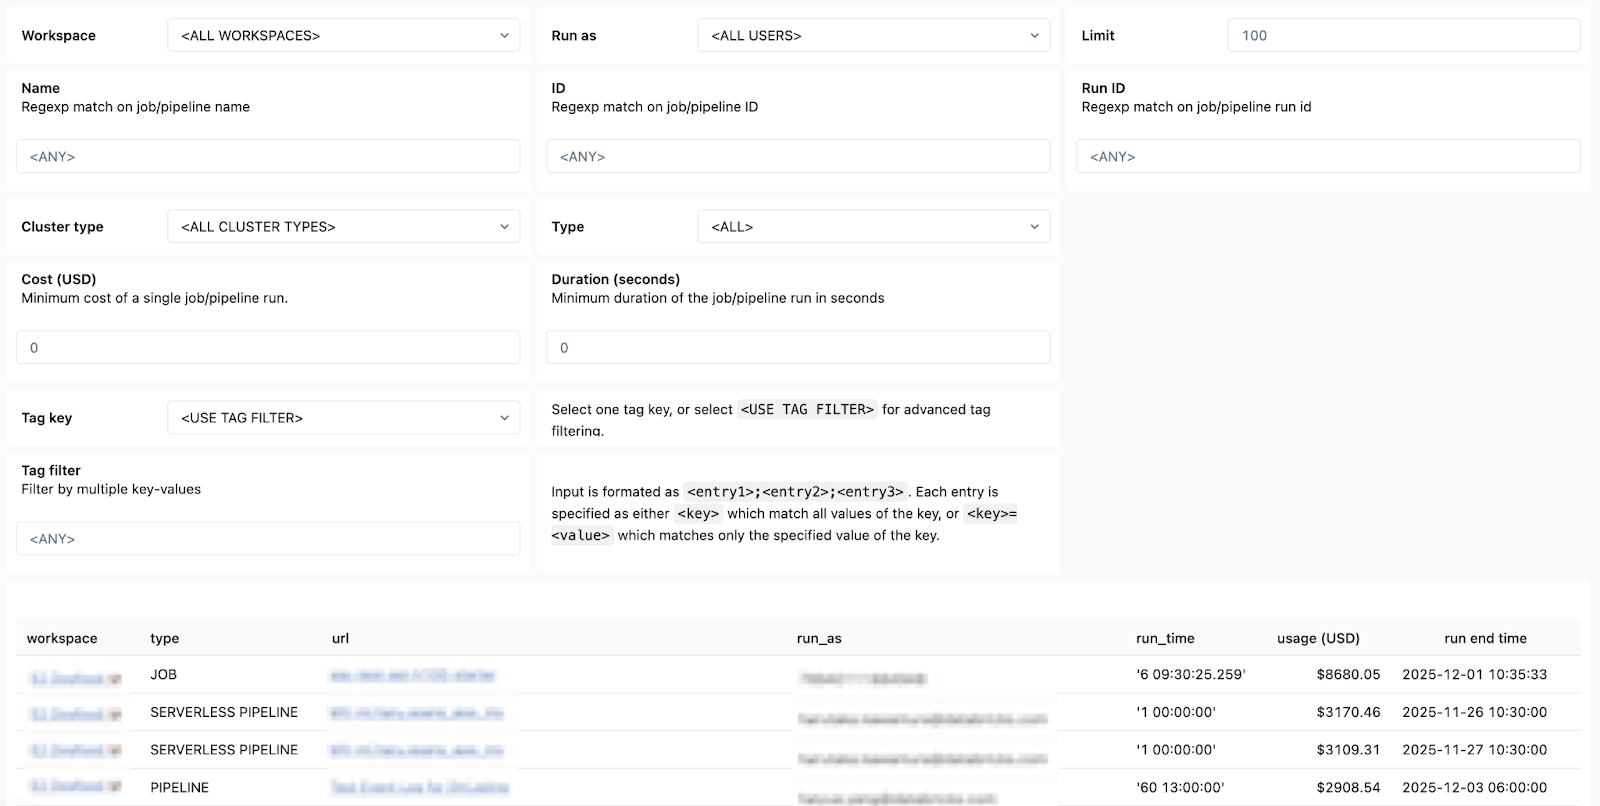
Hygiene views track health rules, timeouts and runtime versions, while ownership views make it simple to find run-as users and job creators so the right person can be contacted.
Limitations and what to watch
System Tables are powerful, but a few practical constraints matter. Retention is finite: most Lakeflow tables keep roughly a year of history, so long-range trend analysis may require exporting data to a separate table before it ages out. Availability of individual tables can vary by cloud, region and account configuration, and some tables or columns may be in preview rather than generally available, so behaviour can change. The SCD2 design means queries must account for effective-dated rows rather than assuming one row per job. Finally, System Tables describe what happened; acting on the findings still depends on clear ownership and a process for decommissioning unused pipelines. Teams evaluating this approach should confirm current table names, availability and retention against the official documentation for their specific cloud.
Used well, System Tables turn platform telemetry into a queryable asset, letting engineers write SQL against a unified schema instead of piecing together signals from several tools. Teams building broader Databricks platforms may also find it useful to review approaches to modernising a data engineering platform with Lakeflow and serving high-QPS models on Databricks. The full technical write-up is available on the Databricks blog.
